PTE-A Speaking: Tables and Line Graphs
*The algorithm is set for fluency, fluency, fluency!! Therefore, a person just needs to keep speaking at an even tempo without any hesitation, pausing at the end of each sentence, for 31 seconds, and they will achieve a perfect score of 90. Does pronunciation matter? Yes, but by using the same procedure of 5 sentences over and over again, your pronunciation will improve.
This procedure is the easiest method to pass the test with a high score, usually well above 79. There is a long debate in second language learning between the roles of fluency and coherence and/or comprehension for the listener. A speaker may speak quickly but coherence is lost due to pronunciation or rhythmic intonation for the listener; conversely, a speaker may speak slowly with good pronunciation but then fluency is lost, so it is a tiring experience for the listener. In any event, Pearson decided that Retell Lecture and Describe Image at going to be all about fluency!
**Remember: As I did, always keep speaking at a normal tempo or pace for 30 seconds without any hesitation–even if you do not know what you are talking about – and you will probably score over 79.
**The key to the algorithm is there are a certain number of keywords coded into any analysis of a spoken response, so it is always wise to say a word that is written in the title or on the graph (process images for example) in every sentence you speak to ensure that you will score. However, as a counterpoint, what is coded if you get a picture that has no words?
** The images below were taken from colour charts from a google search of PTE Describe Image. You will have colour images on your PTE Exam; here, as well as the exam, colour doesn’t really matter in the sense that you are going to follow the same procedure as it is the numbers that correspond to superlatives that do matter.
Table
For the table above:
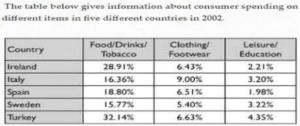
- This table gives information about consumer spending on different items in 5 different countries: Ireland, Italy, Spain, Sweden, and Turkey.
- The first column represents food, drinks, and tobacco.
- The most food, drink, and tobacco was consumed in Turkey, at 32%.
- The least food, drink, and tobacco was consumed in Sweden, at 15%.
- The average food, drink, and tobacco was consumed in Spain, at 18%.
- In conclusion, Turkey will continue to consume the most food, drink, and tobacco in the future.
- Note: a 6th sentence is added to account for the statement about the column.
- Do not worry about the repetitiveness of this task; this is what the algorithm wants – the reading of the complete title and repetition of keywords.
- It does not matter if you do not mention the other 2 columns.
Line Graph:
In the line graph above:
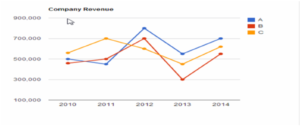
- This line graph exhibits Company revenue for A, B, and C from 2010 to 2014.
- *By 2014, ‘A’ had the highest company revenue.
- B had the lowest company revenue.
- C had the average company revenue.
- In conclusion, it can be predicted that company ‘A’ will continue to have the highest revenue in the future.
- Remember always to say the X-axis in your first sentence!
- When a line graph is short to speak your way through, always take your time with the long conclusion – you should memorize: In conclusion, it can be predicted that…..will continue….. in the future.
- Notice ‘By 2014’ in the text above, this focuses your content on the 3 dots associated with 2014 – this makes the description easier.