IELTS Academic Writing: Double Bar Chart
The bar charts below show the Bachelor degrees by discipline of male and female students over a 15-year period.
Summarise the information by selecting and reporting the main features, and make comparisons where relevant.


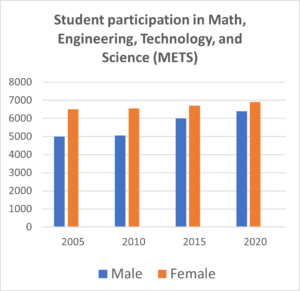
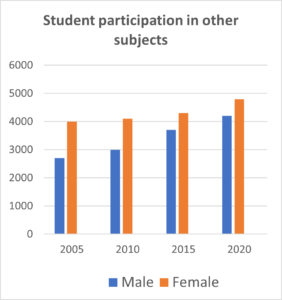
The given charts illustrate the differences between male and female participation in various Bachelor’s degrees by discipline in 2005, 2010, 2015, and 2020.
Overall, the number of females in tertiary studies outnumber men in each subject area over the given years.
The number of females who participate in mathematics, engineering, technology, and science (METS) subjects at a tertiary level is higher than that of males. Participants in these types of degrees remained relatively stable over the four years shown (2005, 2010, 2015, and 2020) with female enrolment remaining between the 6,000 to 7,000 range. Male enrolment rose with an increase from about 5000 in 2005 to approximately 6300 in 2020.
Likewise, the number of women outnumbered men in enrolment in other subjects. Though participation in other scholarly disciplines rose steadily overall, women consistently outnumbered men by approximately a third with their numbers rising from about 4000 in 2005 to above 4800 in 2020. Male involvement in these types of studies grew by 1300 over the period shown, attaining a high of 4100 in 2020. (172 Words)
Compound Sentences
The given charts illustrate the differences between male and female participation in various Bachelor’s degrees by discipline in 2005, 2010, 2015, and 2020.
Overall, the number of females in tertiary studies outnumber men in each subject area over the years given.
The number of females who participate in mathematics, engineering, technology, and science (METS) subjects at a tertiary level is higher than that of males, and participants in these types of degrees remained relatively stable over the four years shown (2005, 2010, 2015, and 2020) with female enrolment remaining between the 6000 to 7000 range. Male enrolment rose with an increase from about 5000 in 2005 to approximately 6300 in 2020.
Likewise, the number of women outnumbered men in enrolment in other subjects. Though participation in other scholarly disciplines rose steadily overall, women consistently outnumbered men by approximately a third with their numbers rising from about 4000 in 2005 to above 4800 in 2020. Male involvement in these types of studies grew by 1300 over the period shown, attaining a high of 4100 in 2020.
Complex sentences
The given charts illustrate the differences between male and female participation in various Bachelor’s degrees by discipline in 2005, 2010, 2015, and 2020.
Overall, the number of females in tertiary studies outnumber men in each subject area over the years given.
The number of females who participate in mathematics, engineering, technology, and science (METS) subjects at a tertiary level is higher than that of males, and participants in these types of degrees remained relatively stable over the four years shown (2005, 2010, 2015, and 2020) with female enrolment remaining between the 6000 to 7000 range. Male enrolment rose with an increase from about 5000 in 2005 to approximately 6300 in 2020.
Likewise, the number of women outnumbered men in enrolment in other subjects. Though participation in other scholarly disciplines rose steadily overall, women consistently outnumbered men by approximately a third with their numbers rising from about 4000 in 2005 to above 4800 in 2020. Male involvement in these types of studies grew by 1300 over the period shown, attaining a high of 4100 in 2020.
Academic Words (Subject Related and Descriptive)
The given charts illustrate the differences between male and female participation in various Bachelor’s degrees by discipline in 2005, 2010, 2015, and 2020.
Overall, the number of females in tertiary studies outnumber men in each subject area over the given years.
The number of females who participate in mathematics, engineering, technology, and science (METS) subjects at a tertiary level is higher than that of males. Participants in these types of degrees remained relatively stable over the four years shown (2005, 2010, 2015, and 2020) with female enrolment remaining between the 6000 to 7000 range. Male enrolment rose with an increase from about 5000 in 2005 to approximately 6300 in 2020.
Likewise, the number of women outnumbered men in enrolment in other subjects. Though participation in other scholarly disciplines rose steadily overall, women consistently outnumbered men by approximately a third with their numbers rising from about 4000 in 2005 to above 4800 in 2020. Male involvement in these types of studies grew by 1300 over the period shown, attaining a high of 4100 in 2020.

