PTE-A Speaking: Describe Image
- Remember: there is no point in clicking forward immediately after finishing part of the Speaking part of the PTE exam because all the 5 tasks in this section are timed; thus, you can’s save time by racing to the next question.
Describe image:
You have 30 seconds to observe…explain the stick
The trick to Describe Image is to always speak 5 sentences in the same order for all images. In this way, you become more fluent as you continue to practice:
Procedure
- INTRODUCTION: This (name of graph type) graph denotes (read the title) (always mention the x-axis)
- Describe a key feature (use a superlative – the highest, the most, the greatest)
- Describe a key feature (use a superlative – the lowest, the least, the worst)
- Describe a key feature (use – the average, fluctuate, or volatile)
key features
- CONCLUSION: Use this phrase and predict an outcome: In conclusion, it can be expected that ___—— will continue to rise in the future ( or in the next year)
For example (though this is a black-and-white picture, it matters not):

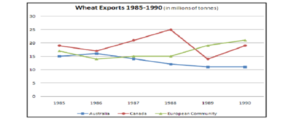
1. This line graph denotes Wheat Exports from 3 regions of the world from 1985 to 1990.
- By 1990, the highest exporter of wheat was the European Community.
- The lowest exporter of wheat was Australia
- The average exporter of wheat was Canada
- In conclusion, it can be expected that Australia will continue to have the lowest wheat export in the future.
Things to note at the time of writing this book or over 1400 tutorials of experience:
*The algorithm is set for fluency, fluency, fluency!! Therefore, a person just needs to keep speaking at an even tempo without any hesitation, pausing at the end of each sentence, for 31 seconds, and they will achieve a perfect score of 90. Does pronunciation matter? Yes, but by using the same procedure of 5 sentences over and over again, your pronunciation will improve.
This procedure is the easiest method to pass the test with a high score, usually well above 79. There is a long debate in second language learning between the roles of fluency and coherence and/or comprehension for the listener. A speaker may speak quickly but coherence is lost due to pronunciation or rhythmic intonation for the listener; conversely, a speaker may speak slowly with good pronunciation but then fluency is lost, so it is a tiring experience for the listener. In any event, Pearson decided that Retell Lecture and Describe Image at going to be all about fluency!
I once said this during a Describe Image task just to check to see if I was right; spoken in an even tone and at a normal pace: “In conclusion, it can be predicted that I will fail this test because I do not know what I am talking about.” It worked! The score came back at 90 for speaking. I was led to this understanding of Describe Image through a tutorial whereby the client said during a listening exercise, “I have trouble taking notes while the speaker is speaking.” However, previously in our conversation, he had said that he received a 90 in speaking. Thus, I asked him: “How can you say you have difficulty taking notes when you have just told me that you received a 90 in speaking?” How did you do Retell Lecture, I asked… and he said to me: “a friend of mine told me to just remember 2 things the speaker said and repeat them every second sentence, so I did.” I took this man at his word and started to think about how the algorithm worked.
The procedure above has been proven time and time again and has been recorded in notes and emails to myself and in testimonies on my ability to teach on my previous employer’s website. It works well every time.
In the line graph above, the saying ‘By1990′, helps point to the three endpoints – the highest, the lowest, and the average. This technique makes it much easier, in the 25 seconds, you have to look at the graph, to organize your 3 body or middle statements after the Introductory sentence.
The following graphs, charts, or images all contain useful underlined words to help you prepare for the Describe Image task on the PTE exam, and keep you fluent.
**Remember: As I did, always keep speaking at a normal tempo or pace for 30 seconds without any hesitation – even if you do not know what you are talking about – and you will probably score over 79.
**The key to the algorithm is there are a certain number of keywords coded into any analysis of a spoken response, so it is always wise to say a word that is written in the title or on the graph (process images for example) in every sentence you speak to ensure that you will score. However, as a counterpoint, what is coded if you get a picture that has no words?
** The images below were taken from colour charts from a google search of PTE Describe Image. You will have colour images on your PTE Exam; here, as well as the exam, colour doesn’t really matter in the sense that you are going to follow the same procedure as it is the numbers that correspond to superlatives that do matter.
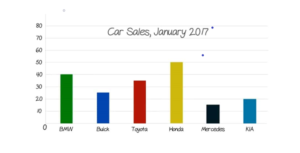
A simple Bar Chart:

- This bar chart represents Car Sales for January 2017.
- The highest number of cars sold was Hondas.
- The lowest number of cars sold was Mercedes.
- The average number of cars sold was Buicks.
- In conclusion, we can expect that Hondas will continue to be the most cars sold in the future.
- Note: The importance of the long sentence in the conclusion to bring you to 30 seconds when doing a short graph – speak slowly at an even speed/tempo
- Remember: it is about fluency, not accuracy… it more important to keep speaking to the end of a sentence, pause, then speak through another sentence.

